---
execute:
  eval: false
  echo: true
  warning: false
format:
  html:
    code-fold: false
---In [1]:
Importing packages for the DT.
In [3]:
import numpy as np
import matplotlib.pyplot as plt
from sklearn.datasets import load_breast_cancer
from sklearn.tree import DecisionTreeClassifier, plot_tree
from sklearn.model_selection import train_test_split
from sklearn.metrics import classification_report
Importing the breast cancer dataset.
In [4]:
dataset = load_breast_cancer()
X_train, X_test, y_train, y_test = train_test_split(dataset.data, dataset.target, test_size=0.3, random_state=42)
Instantiating and fitting a DT.
In [5]:
dt = DecisionTreeClassifier(criterion='entropy', max_depth=2, random_state=42)
dt.fit(X_train, y_train)
DecisionTreeClassifier(criterion='entropy', max_depth=2, random_state=42)In a Jupyter environment, please rerun this cell to show the HTML representation or trust the notebook.
On GitHub, the HTML representation is unable to render, please try loading this page with nbviewer.org.
DecisionTreeClassifier(criterion='entropy', max_depth=2, random_state=42)
Plotting the tree structure.
In [6]:
plt.figure(figsize=(12, 8))
plot_tree(dt, feature_names=dataset.feature_names, class_names=dataset.target_names, filled=True, rounded=True)
plt.show()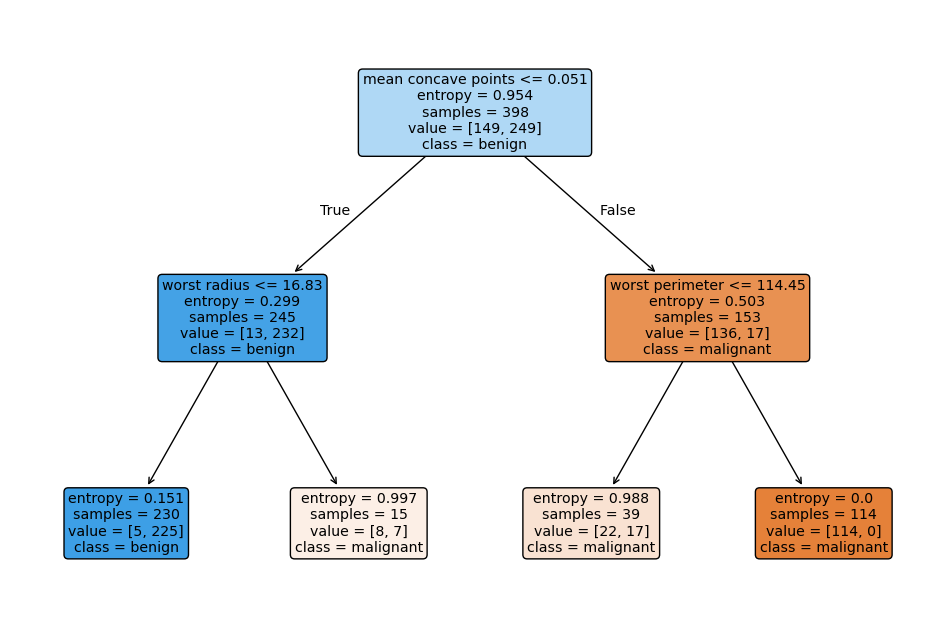
Showing the importance of each feature.
In [7]:
plt.figure(figsize=(8, 5))
importances = dt.feature_importances_
plt.barh(dataset.feature_names, importances, color='skyblue')
plt.xlabel("Importance Score")
plt.show()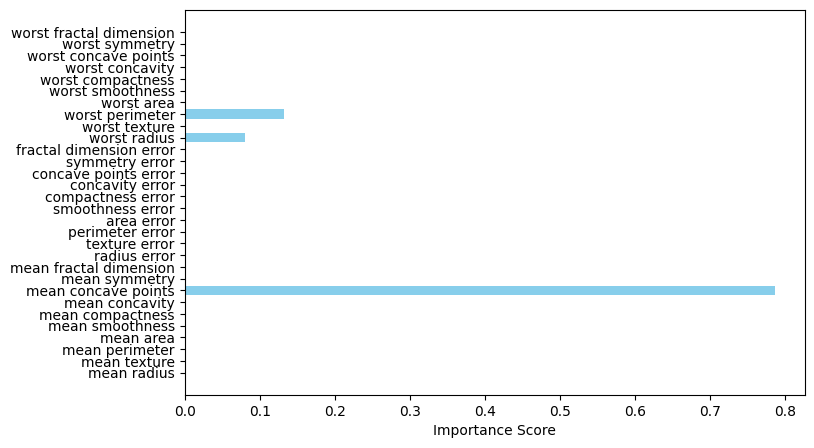
Printing the classifications reports of the model.
In [8]:
y_pred = dt.predict(X_test)

rep = classification_report(y_test, y_pred)
print(rep)
precision recall f1-score support
0 0.84 0.97 0.90 63
1 0.98 0.89 0.93 108
accuracy 0.92 171
macro avg 0.91 0.93 0.91 171
weighted avg 0.93 0.92 0.92 171