---
execute:
  eval: false
  echo: true
  warning: false
format:
  html:
    code-fold: false
---In [1]:
Importing the packages.
In [3]:
import torch
import numpy as np
import matplotlib.pyplot as plt
from torchvision import transforms
from torchvision.datasets import MNIST
Plotting the noise schedule of SMLD.
In [3]:
T = 100
sigma_1 = 0.01
sigma_T = 10.0

steps = np.arange(1, T + 1)
smld_sigmas = sigma_1 * ((sigma_T / sigma_1) ** ((steps - 1) / (T - 1)))

plt.figure(figsize=(10, 4))
plt.plot(steps, smld_sigmas, color="blue", linewidth=2.5)
plt.xlabel(r"$t$", fontsize=12)
plt.ylabel(r"$\sigma_t$", fontsize=12)
plt.grid(True, which="both", linestyle="--", alpha=0.5)
plt.tight_layout()
plt.show()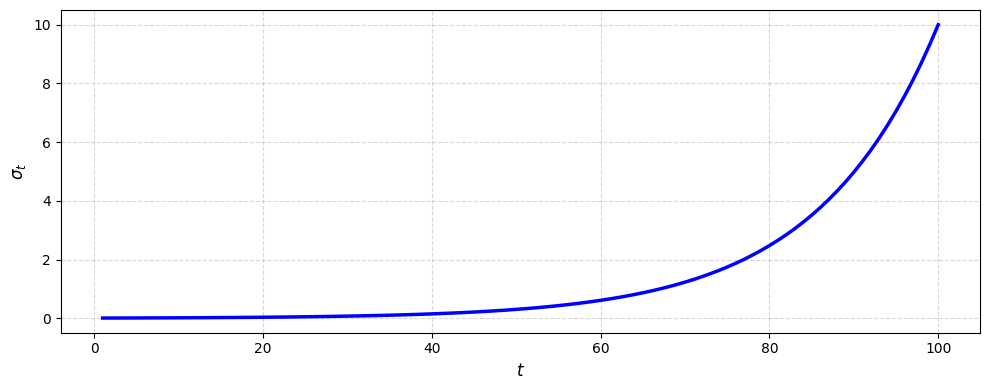
Showing the data corruption in different noise scales.
In [6]:
dataset = MNIST(root="./data", train=True, download=True, transform=transforms.ToTensor())
x0, _ = dataset[0]
x0 = x0.unsqueeze(0)

selected_indices = [0, 15, 35, 55, 75, 99]
fig, axes = plt.subplots(1, len(selected_indices) + 1, figsize=(16, 3))

axes[0].imshow(x0.squeeze().numpy(), cmap="gray")
axes[0].set_title(r"Original $\mathbf{x}_0$", fontsize=12)
axes[0].axis("off")

for i, idx in enumerate(selected_indices):
    sigma = smld_sigmas[idx]
    z = torch.randn_like(x0)
    xt = x0 + sigma * z

    axes[i + 1].imshow(xt.squeeze().numpy(), cmap="gray")
    axes[i + 1].set_title(r"$\sigma_t=$" + f"{sigma:.2f}", fontsize=11)
    axes[i + 1].axis("off")

plt.tight_layout()
plt.show()